
In yesterday’s post on Malaysia’s 15th General Election, I showed that constituency-level ethnic structure is a very robust and consistent predictor of which coalition prevailed in elections on the peninsula. But there is a lot more at play than just ethnicity in explaining election results, and new data from Malaysia’s Department of Statistics allows us to be much more comprehensive in our analysis.
This post is a “data-dump” of additional exploratory analysis. The tl;dr version is that urbanization is another strong predictor of which coalition prevailed in peninsular constituencies, but accounting for urbanization mostly does not wipe out the predictive capacity of ethnic structure.
I want to focus on four variables in particular.
- Constituency size (area in km2)
- Constituency population density (log of population/km2).
- Median income
- Unemployment rate
Taking these into account will give us a sense of how much the relationship between ethnicity and election outcomes is plausibly due to things that happened to be correlated with ethnicity: rural and lower-income constituencies in peninsular Malaysia area also those which tend to be majority bumiputera. This is a major inferential challenge that I have written about on this blog and in this piece in the Journal of East Asian Studies (pdf).
What you see below are sixteen graphs. Let me explain. For each variable (see the four subtitles), we have the correlation among peninsular constituencies between that variable and each coalition’s vote share. We also have the predicted probability of victory, derived from a simple multinomial logistic regression where that variable is the only predictor.
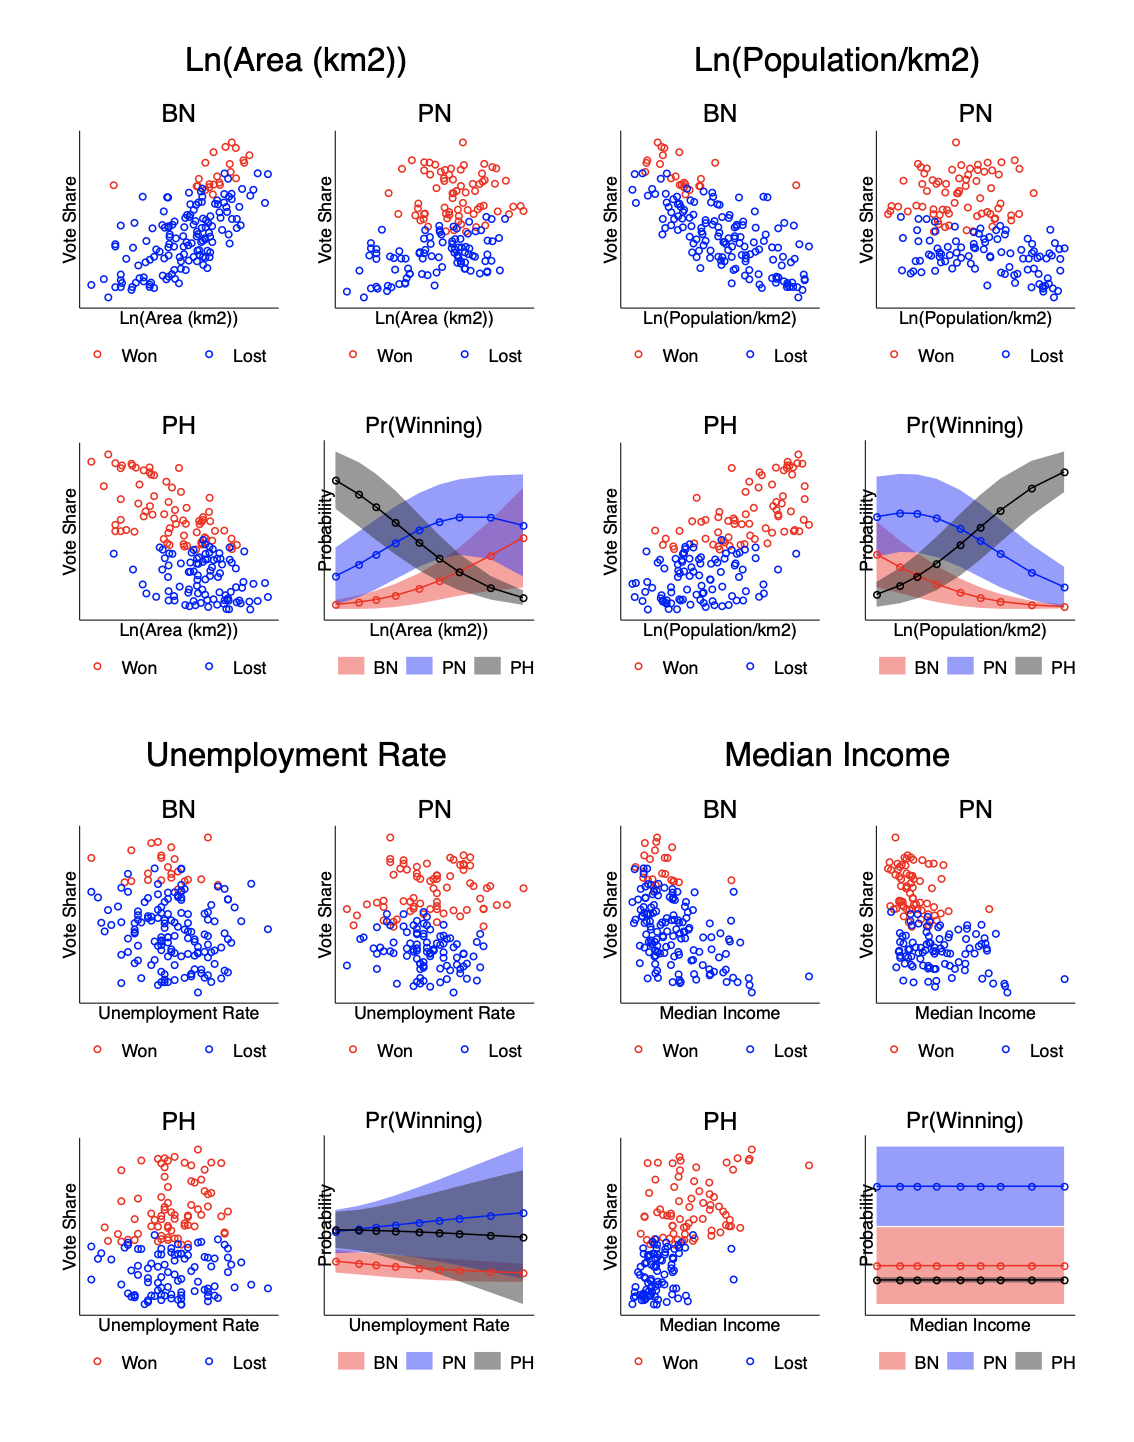
The summary message from this graph is pretty simple. There is indeed a strong correlation between constituency size and constituency population density—each a reasonable measure of urbanization—and coalition vote shares. PN did better in rural constituencies with low population densities, and PH did better in urban constituencies with high population densities. Looking at income and unemployment, though, we find no relationship whatsoever.
Because these analyses are only looking at bivariate relationships between one predictor and each election outcome, though, they don’t allow us to compare the strength of various predictors. For that, I estimate a series of OLS regressions of the following form:

We are predicting each coalition’s vote share as a function of ethnicity, the four variables above, and state fixed effects 
| BN Vote Share | PN Vote Share | PH Vote Share | |
| Bumiputera Population Share | 0.27*** | 0.59*** | -.86*** |
| (0.04) | (0.03) | (0.03) | |
| Ln(Area) | -2.38 | 1.00 | 1.64 |
| (1.23) | (1.18) | (1.74) | |
| Ln(Population/km2) | -5.09* | 2.11 | 3.12* |
| (1.17) | (1.20) | (0.61) | |
| Unemployment Rate | 1.06 | -1.44 | 0.01 |
| (0.72) | (0.94) | (0.50) | |
| Median Income | -0.00 | -0.00 | 0.00* |
| (0.00) | (0.00) | (0.00) | |
| N | 164 | 164 | 164 |
The results are very clear: even accounting for urbanization and economic factors, ethnic structure is a very strong and consistent predictor of each coalition’s vote share.
To see how these results compare, I’ve estimated a multinomial logistic regression with all the predictors listed above (and the state fixed effects), and plotted the predicted probability of each coalition winning across the deciles of each predictor.

Ethnic structure remains a very strong predictor of which coalition prevails in peninsular constituencies. But we also wee that PH does well in densely populated places. And interestingly, once we account for ethnic structure and population density, PH also seems to do better in larger districts. Score one for multiple regression.
As a final exercise, let us consider the possibility that the relationship between ethnic structure and electoral outcomes depends on how urban or rural a district is. We can test this possibility by dividing constituencies into quartiles by how densely populated they are, and allowing the relationship between ethnicity and the probability of winning to vary across the quartiles. To read the results below, note that the x-axis tells you the relationship between ethnic structure and vote share for each coalition: points to the right of the line at 0 mean that higher bumiputera population share is associated with a greater chance of victory for that coalition, the reverse for points to the left of 0.

In rural and semi-rural districts, PN’s likelihood of victory is positively related to bumiputera population share, and reverse for PH’s likelihood of victory: PH is less likely to win the higher the bumiputera population share. This is the same as what I found above. But if you look at urban districts, you find no relationship between ethnic structure and the probability of victory for any party: confidence intervals are very large and we cannot reject the null hypothesis of no relationship.
Summing up, here is what we have found:
- Urbanization is a very good predictor of vote share and the probability of victory for each of the three coalitions in peninsular elections
- Even accounting for urbanization, ethnic structure is still a remarkably strong predictor of election outcomes in the peninsula.
- When we allow the relationship between ethnic structure and election outcomes to vary according to how urban that constituency is, we find that that relationship disappears in the most urban peninsular constituencies.
Now we wait to see who forms the government.
NOTES
* State fixed effects are important for accounting for historical patterns of party politics (Kelantan is a PAS stronghold, Johor is an UMNO stronghold, etc.).
