
An important new paper in the Proceedings of the National Academy of Sciences of the United States of America argues that as COVID-19 cases go up within a country, so too does support for the chief executive. As the authors write in their title “The rise of COVID-19 cases is associated with support for world leaders” (PDF).
This strikes me as impossible. But the great thing about the Open Science movement is that we can now check the work of others to see how it holds up to closer statistical scrutiny.
Upon reading the article, the first thing that jumped out at me are the figures on page 3, which are presented as evidence that as COVID-19 cases go up, so does approval for the chief executive.
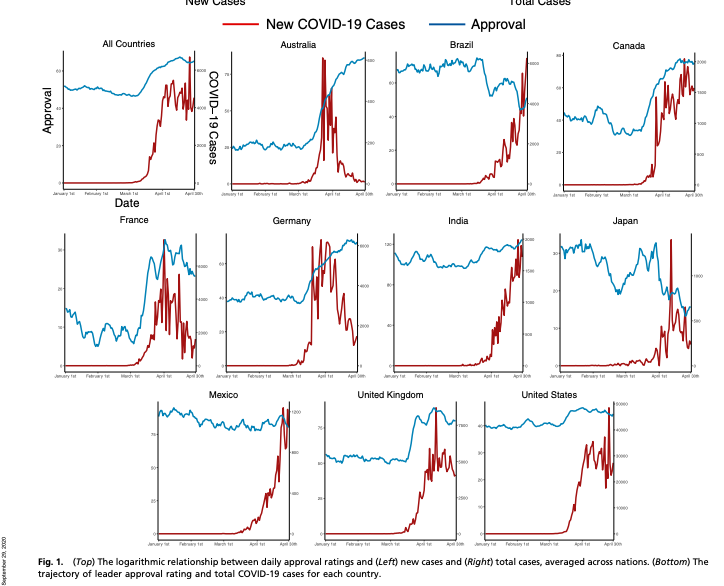
But as everyone who works with time series data know, we cannot simply trust two trending time series (see Granger and Newbold 1974). Such regressions are very frequently spurious, a symptom of cointegrated time series. Even though the authors of the PNAS paper use individual data, I suspect that because the independent variable is constant across individuals for each day (it is a daily case count for the political unit of interest), the same inferential problems will arise.
To check if this is the case, I downloaded the data from the Open Science Foundation’s online repository. I focus on the Hong Kong case because this is the first piece of evidence that they present. The HK data are individual survey responses matched to daily case counts, analyzed using random effects for the individual (many are interviewed more than once). There is no attempt to model time-series dynamics except for by also including lags of the daily case counts. I collapsed these to create a variable which is the daily average support for the Hong Kong chief executive, and then estimated a simple ARIMA(1,1,0) model with case counts as the exogenous predictors of average support. Here is what we find:
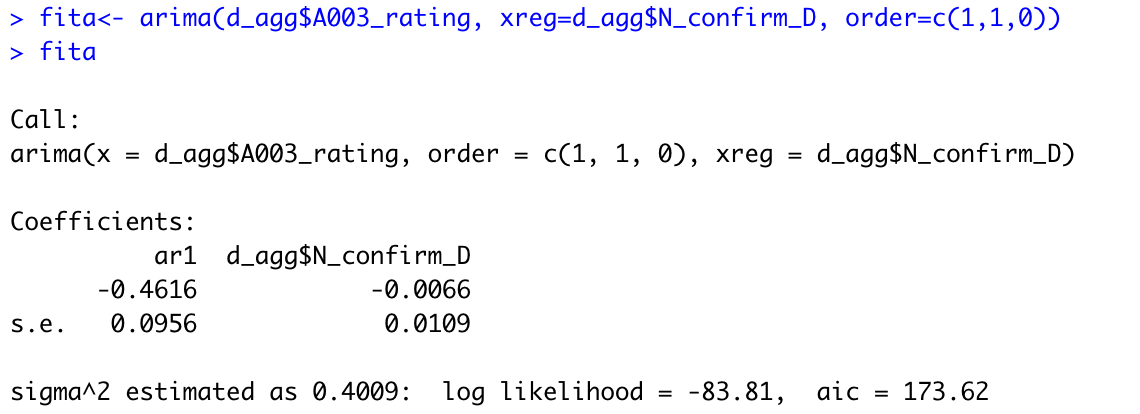
In this analysis, no evidence of a positive correlation between COVID-19 cases and support for the chief executive. Basically no results either if you use log of support or log of daily cases.
Of course, I have only touched the first of the authors’ data sources. I have done nothing with the other cross-national and within-country (in the US) data that they have; it could be that those analyses withstand greater scrutiny. And I have done none of the formal statistical testing needed to identify the proper time series model for the aggregated Hong Kong data, I just used the simplest approach I know of. But it’s important to remember that time series econometrics is hard, and having lots of survey data does not make the particularly thorny challenges of inference from trending time series disappear.
If you want to explore further, here is the exact code that I ran, using the data from the OSF link above.
##################

##Hong Kong Data##

##################
library(Hmisc)
library(lme4)
library(lmerTest)
library(ggplot2)
library(plyr)
library(plm)
d<-read.csv("~/Desktop/HongKong.csv")
d$log_A003_rating<-log(d$A003_rating+1)
d$log_N_confirm_D<-log(d$N_confirm_D+1)
d_agg<-aggregate(d,by=list(d$date),FUN = mean,na.rm=T)
fita<- arima(d_agg$A003_rating, xreg=d_agg$N_confirm_D, order=c(1,1,0))
fitb<- arima(d_agg$log_A003_rating, xreg=d_agg$N_confirm_D, order=c(1,1,0))
fitc<- arima(d_agg$log_A003_rating, xreg=d_agg$log_N_confirm_D, order=c(1,1,0))
fita
fitb
fitc
