
Two weeks ago, the Diversity Committee of the Society for Political Methodology released a diversity report (PDF) that identified, in blunt terms, that the SPM
faces severe diversity challenges. There is a disproportionately low number of women and minorities in the field of political methodology in all spheres- graduate student body, assistant professors, tenured professors, journal editors, etc.
Although the data in its report are striking on their terms, even more interesting was the comparison of the Political Methodology section with the rest of APSA’s organized sections. Figure 3 in the report (tweeted by Patrick Egan and based on data from Jacob Montgomery) shows that Political Methodology has the fewest women as a percentage of all section members of any APSA organized sections.
Whether you think it's selection, discrimination, or both,this is an illuminating chart on gender breakdown of membership in APSA sections from just-released PolMeth report, here https://t.co/wGdEnyLIcz pic.twitter.com/bDloKq0bxv
— Patrick Egan (@Patrick_J_Egan) February 1, 2018
https://platform.twitter.com/widgets.js
One question that follows from this is whether or not the APSA annual meeting program reflects similar patterns. Comparing gender breakdown by section membership and gender breakdown by participants in the annual meeting would be one way to see if, for example, the annual meeting reflects-and, as a result, might reinforce-such gender imbalances across sections.
This is an issue that many of us care about. I was co-organizer of the Comparative Politics organized section with Sara Goodman, and we thought explicitly about “manels” but not directly about the overall gender balance of all of our panels and whether or not it matched our section membership. However, APSA has generously provided us with demographic data for all participants in the 2017 annual meeting. That allows us to not only compare the gender balance across different sections (not just our own), but also to check (using Jacob Montgomery’s data) whether or not they reflect section membership.
Here is what we have found.
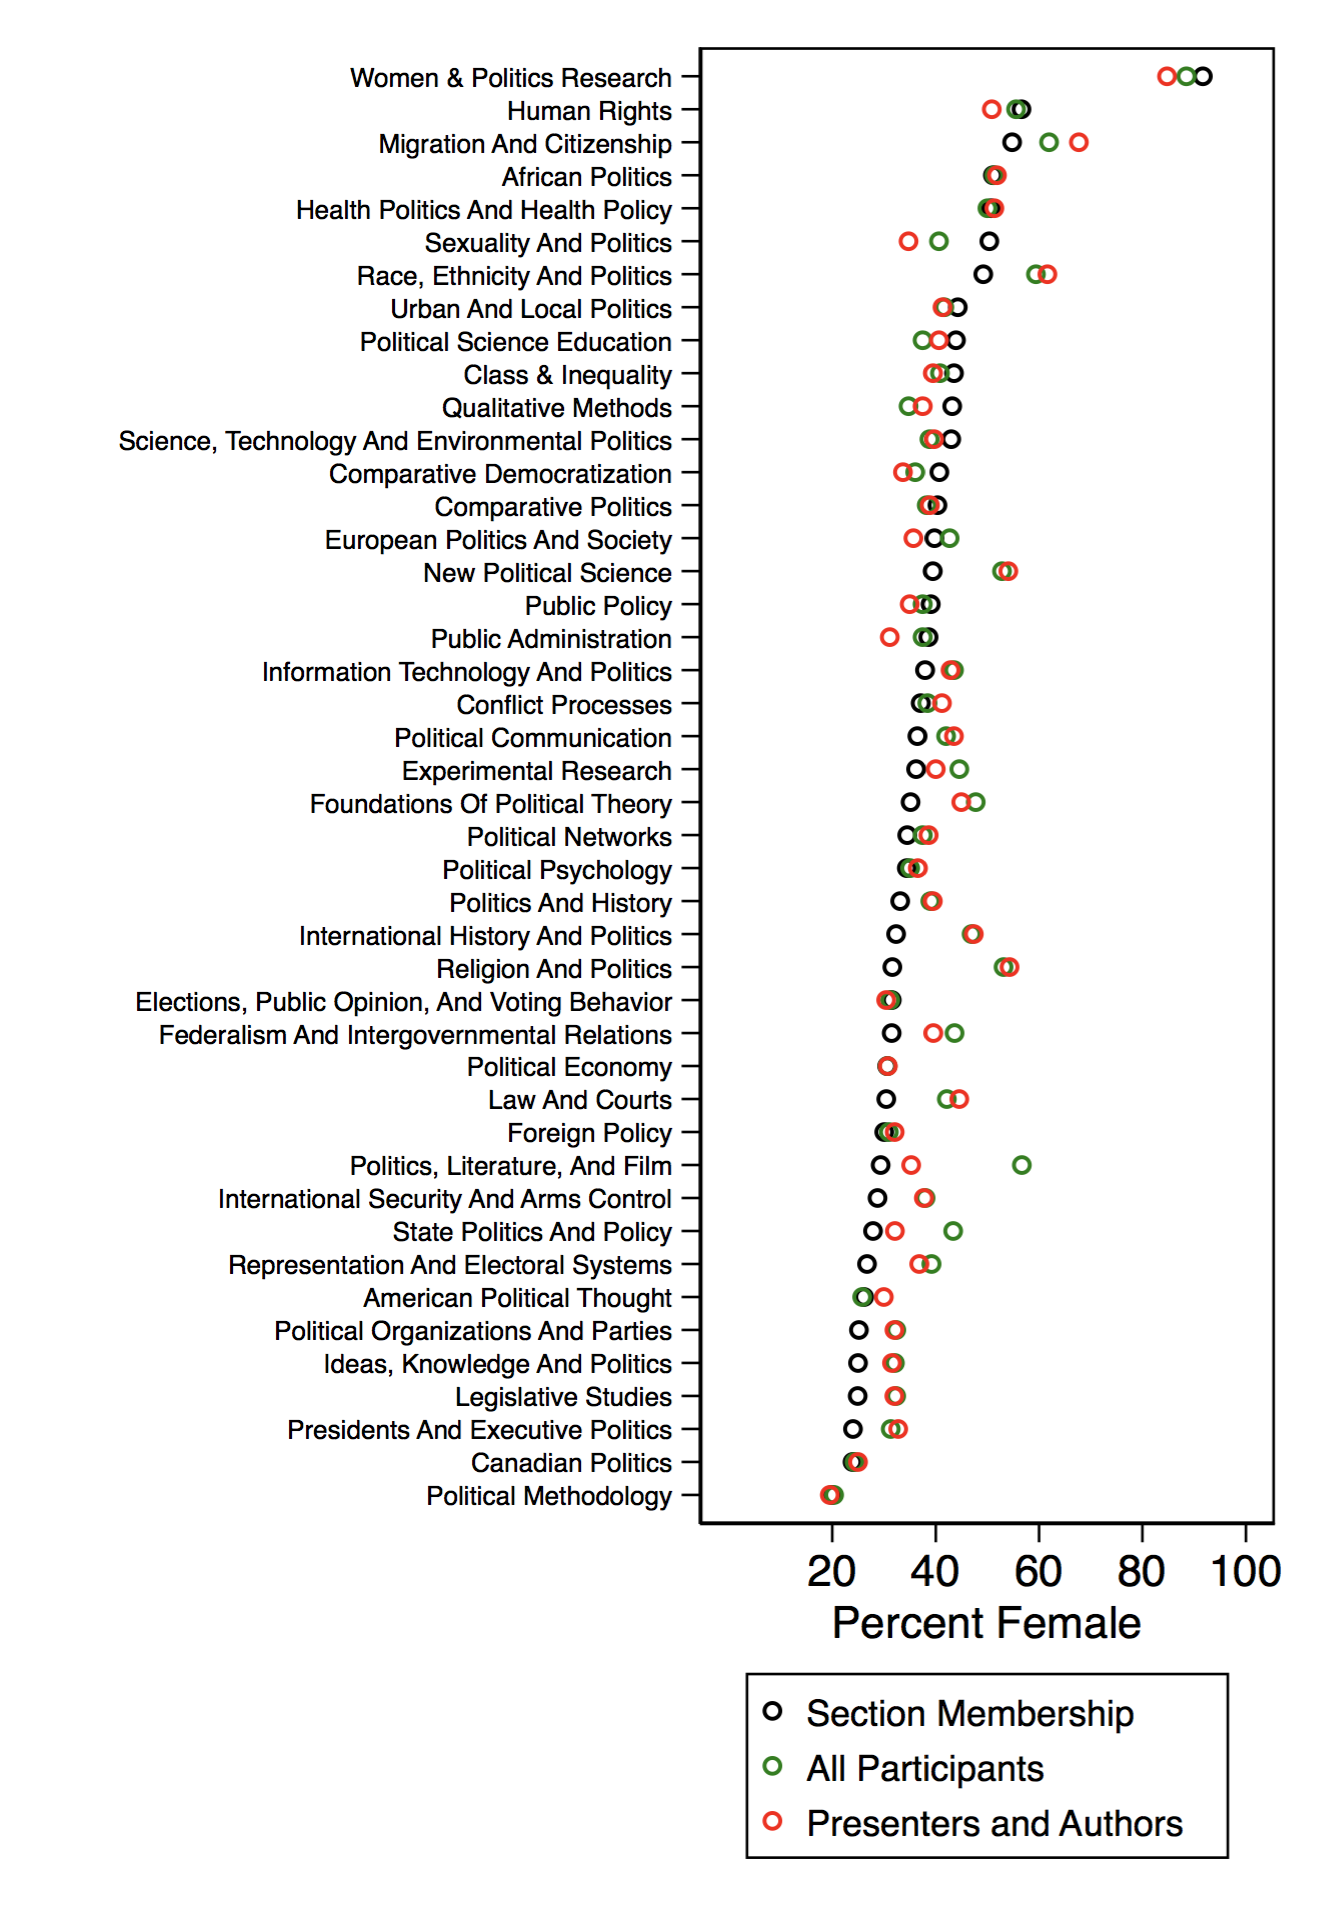
The black dots correspond to Montgomery’s data on the percentage of each section’s membership that is female. The green dots, by contrast, are the percentage of each section’s total panel participants (all chairs, discussants, presenters, and authors) that are female. Because many people argue that the roles of “chair” and “discussant” allow for only token participation, the red dots are the percentage of each section’s authors and presenters only that are female.
We learn from this exercise that many sections are representative of their membership, but not all are. New Political Science and Race, Ethnicity, and Politics, for example, have a lower percentage of women as members than they do women as presenters. The reverse is true for Qualitative Methods. Comparative Politics (our section) was about as diverse at APSA 2017 according to gender as one might expect given our membership. The same is true of Political Methodology; while far below average relative to the general APSA membership (35%), APSA participation does reflects its section membership.
There is much to think about here. One question that might follow is why there is such limited diversity in section membership among those sections at the bottom of this figure. Their panels at APSA are more diverse than we’d otherwise expect. To the extent that section membership matters-and I believe that it does-this would be one area in which the discipline might focus its efforts.
