
Indonesia’s 2024 presidential election was atypical from among post-New Order presidential elections in that it featured three presidential contenders, but the results were decided in one round only. In every presidential election since 2004, either there was a run-off among the top two candidates in the first round, or there were only two candidates. In 2024, three tickets—Prabowo Subianto-Gibran Rakabuming Raka, Anies Baswedan-Muhaimin Iskandar, and Ganjar Pranowo-Mahfud MD—each ran campaigns and appeared on the presidential ballots. Aided by the strong endorsement of the wildly popular incumbent president Joko Widodo, Prabowo Subianto handily won the election.
I like to make maps of Indonesian election results. These are easiest when there are only two candidates, because strong results for one entail weak results for others. It is harder to plot with three candidates! But it can be done: below is a ternary plot created using the tricolore package in R.*

As you can see, there some missing observations, especially in Papua, where data aren’t reliable. But nonetheless, this figure conveys four important pieces of information.
- Prabowo (the blue areas) fared really well nearly everywhere.
- Where Prabowo did less well, he mostly divided his vote equally between Ganjar and Anies. Anies did dominate some districts; Ganjar dominated no districts.
- Anies’s best showing was in Aceh and parts of Jambi and West Sumatra.
- Ganjar did well only in parts of Java, but even here he divided his votes with Prabowo and Anies.
Zooming in on Java helps this last point to become visible.
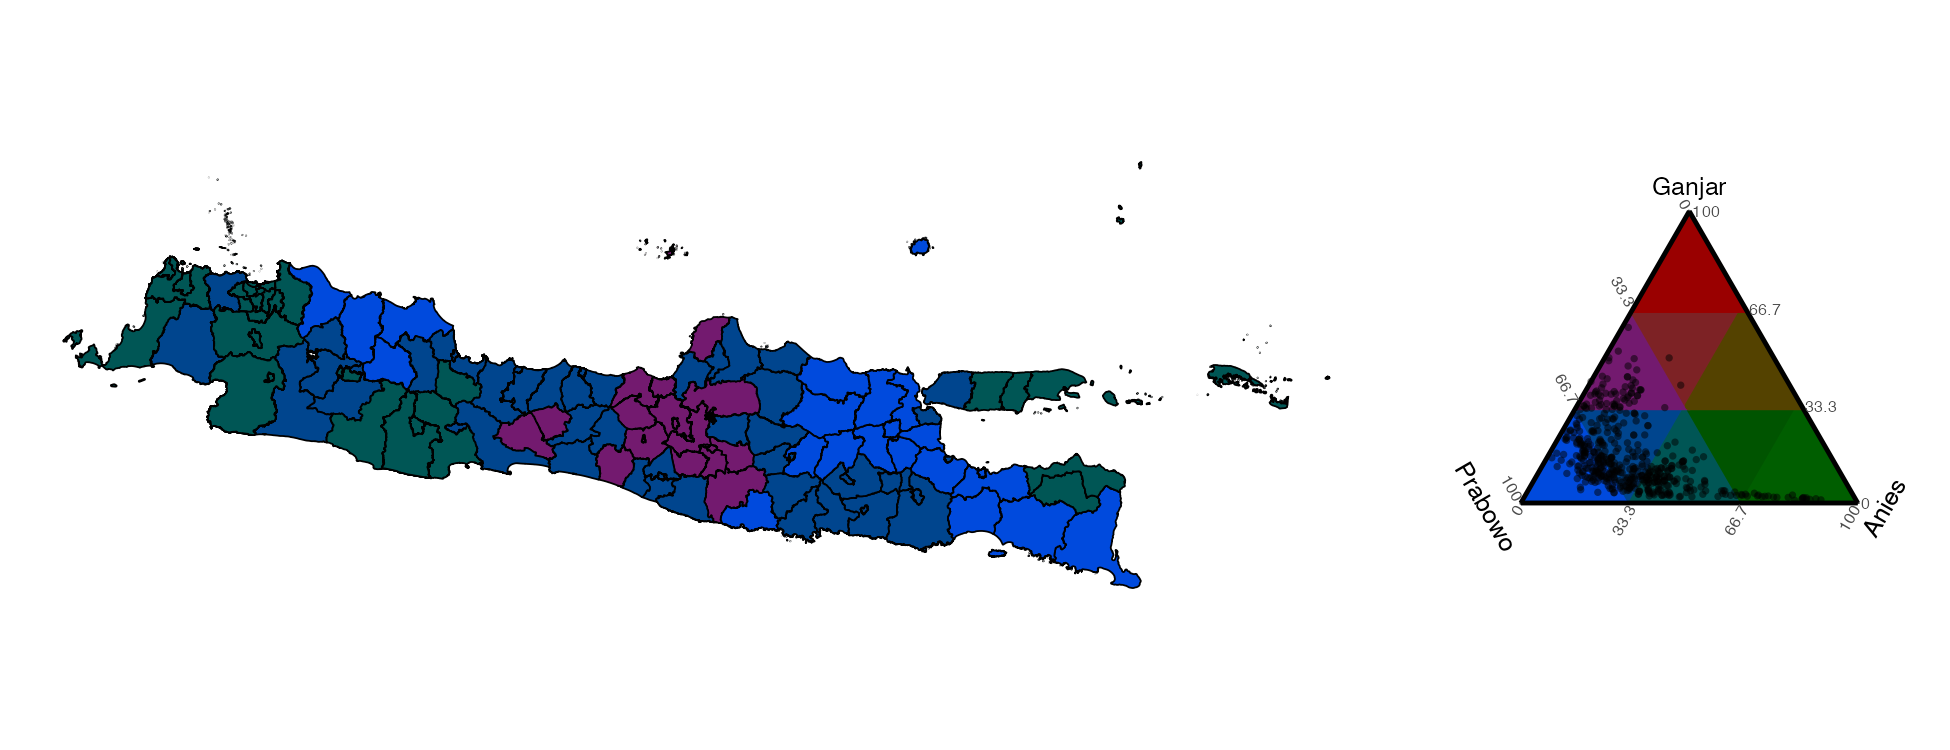
The figure matches my understanding of the results in Java quite well. Prabowo did extremely well around Jakarta, Surabaya, and in much of East Java. In much Central Java, Prabowo split the vote with Ganjar. In West Java, Banten, and Madura, Prabowo split the vote with Anies. Watch this space for more interpretations.
NOTES
* See Schöley J, Kashnitsky I (2024). “tricolore. A flexible color scale for ternary compositions.” CRAN. Version 1.2.4, https://cran.r-project.org/package=tricolore; and Schöley J (2021). “The centered ternary balance scheme. A technique to visualize surfaces of unbalanced three-part compositions.” Demographic Research, 44, 443–458. doi:10.4054/DemRes.2021.44.19.
