With less than a week to go until the 2020 presidential election, Americans are ready for a seemingly interminable election season to come to an end. But one thing seems increasingly certain: Election Night won’t be the end of it. From the long wait times anticipated as swing states like Pennsylvania count absentee ballots, to the president’s continued refusal to acknowledge that he will abide by the outcome, you can bet that when you wake up on November 4 the election won’t yet be over.
This is worrying. Americans are used to believing that election night produces decisive results, because for all presidential elections except for 2000 it has. But a delayed announcement of the winner will be more than an annoyance, it will undermine faith in the results of the elections. In a recent Supreme Court ruling, Justice Kavanaugh wrote that it might be legitimate to not count votes “to avoid the chaos and suspicions of impropriety that can ensue if thousands of absentee ballots flow in after Election Day and potentially flip the results of an election.” Of course, Justice Kagan’s dissent (PDF) that “there are no results to ‘flip’ until all valid votes are counted” reveals exactly the issue: stopping the vote count to avoid suspicions of impropriety will generate the very suspicions of impropriety that Kavanaugh seems to want to avoid.* But no matter. The president himself wants a final result on November 3, because he believes that the more votes are counted, the worse off he will be.
Whatever the particular of how this election is resolved, though, will American have faith in the result, even if their preferred candidate has lost? Or will they conclude from the election that the election was fraudulent, unfair, illegitimate, or somehow rigged?
Some new survey data can shed light on these questions. Shana Gadarian, Sara Goodman, and I have been working for the past six months on a NSF- and Cornell Center for the Social Sciences-supported project on the politics of the COVID-19 pandemic. And the other day we received our most recent round of survey data, fielded between October 15 and October 21, which contains an important piece of information that we can use to anticipate how Americans will interpret the election results.
As part of the survey,** we asked respondents a simple question.
To what extent do you agree or disagree with the following statement: If Trump/Biden wins the election, we will know American elections are rigged.
The words “Trump” and “Biden” were randomized in the survey, so half of our 1871 respondents were asked to evaluate a Trump victory, and other half to evaluate Biden victory. Randomization combined with a large sample sizes means that we can compare average responses to the two versions of the question to get a good sense of what Americans will believe in these two hypothetical states of the world—one of which will become actual in the coming weeks.
Now, this is a stark question. And it is easy to give an expressive answer: yeah sure, if my guy loses of course this whole thing is rigged! It is pretty costless to give extreme answers like these, and this means that perhaps people are just sharing their emotional reactions rather than their actual beliefs or values. Moreover, rigged is ambiguous. Does this mean illegally manipulated? Or just preordained? Unfair in some vague sense? Something else entirely?
But respondents had five possible answers that they could give, and even if they felt some misgivings they did not have to respond “Strongly Agree” if their candidate were not declared the winner. I, for example, would answer “Neither Agree nor Disagree” to this question if my non-preferred candidate were to win. And even if respondents’ answers are entirely expressive and emotionally driven, we know for certain that the airwaves and social media will be plastered with exactly those sorts of expressive claims from elites associated with the losing candidate. So these results might give us a hint as to just how much latent or mobilizable sentiment might be out there in the American mass public.***
Here is a graphic that summarizes our main results by comparing Trump wins versus Biden wins versions of the question by the respondent’s partisan affiliation (Democrat, Republican, or something else).
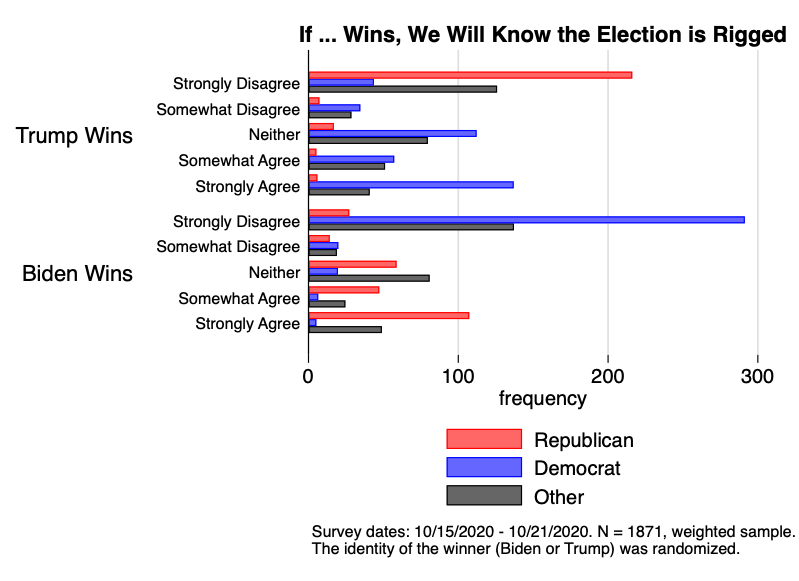
These results are, in a word, extreme. To wit, the modal Republican respondent strongly agrees with the view that if Biden wins, we will know that the elections were rigged. And the modal Democrat respondent strongly agrees with the view that if Trump wins, we will know that the elections were rigged. Those who aren’t affiliated with either party (either because they are nonpartisan, or because they identify with a third party) are most likely to strongly disagree that elections were rigged. But even among those respondents, a surprisingly large number would agree or strongly agree that elections were rigged no matter who wins.
How much do these differences reflect to partisanship itself, versus other things like demography or context? To see this, we estimated some OLS regressions where we interacted partisanship with our randomized Biden/Trump variable, and included a large set of covariates, flexibly adjusting for nonlinear associations by urban/rural, education, income, gender, race, and state fixed effects. This is a pretty conservative approach. Here is what we find when we use this model to predict what respondents’ levels of agreement are.
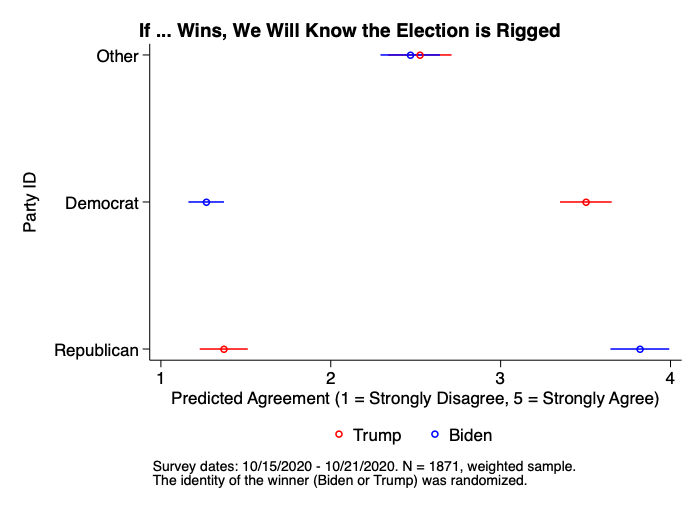
So… these are massive differences in responses among the partisans, and they cannot be explained by the demographic and geographic covariates that we have available to us.****
But it is also interesting to ask about those other demographic differences as well. To do this, we estimate four more OLS regression models. In each, we add to the two-way interaction of party ID and Biden/Trump a third interaction: by age categories, by race, by gender, and by education level. Below, we show differences across these demographic categories (averaging across and hence controlling for the differences in partisan composition across these groups).
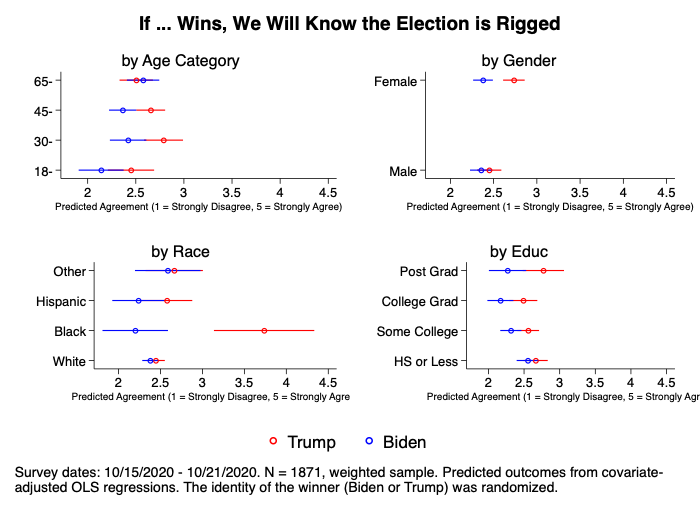
We can see here that—after accounting for partisan differences—there are few differences in the perceived legitimacy of a Biden versus Trump election across these demographic categories. Two exceptions stand out: women would be more likely to find a Trump election illegitimate than a Biden election, and Black Americans are far more likely to find a Trump election illegitimate than a Biden election. That last result is particularly striking, highlighting the essentially racialized nature of this presidential election and its implications for electoral legitimacy in the United States.
There is more to dig into in these data. Got another idea of a covariate to explore? Put it on the list! But these data suggest that we can expect some pretty polarized reactions to the election next week. Partisan competition may be producing a fundamental political divide over the institutions and legitimacy of democracy itself.
I hasten to emphasize once again that these could just be expressive views, emotional reactions that don’t reflect behavior or broader political orientations. But if savvy politicians know how to exploit such emotional reactions, we could be in for a dangerous ride. Do we live in a world in which politicians will exploit such emotional reactions to news and events that their supports don’t like? It’s a waiting game right now.
NOTES
* Look at the big brain on Brett! Also, laughably bad with his sources. Whelp. It is what it is.
** The survey is nationally representative. We can demonstrate this statistically.
*** If the president is on Twitter objecting to the results of the election, you can bet that he will use the word rigged.
**** Even with all of the state fixed effects and other covariates, the t-statistic on the Biden × Democrat coefficient is 20. Twenty.